|
3/31/2017 March 31, 2017Keeping with the theme of the Global Goals, seventh graders have begun working on an infographic project that will combine their studies of African countries, the Global Goals, and graphic design. Each student has been assigned an African country and we have begun building the graphics to display information about that country as well as current data regarding their progress or lack of progress toward achieving some of the Global Goals. We have begun this infographic project in PowerPoint as its charting function lends itself better to what we are trying to accomplish. This does mean, however, that students' work is saved on the network server and not in the cloud. A student can work outside of school on this project by uploading a copy of the file to Google Drive and then downloading it at home, but it will be important to remember to upload the revised version back to Google Drive for use in school. I will be explaining that process to them once we move beyond the first slide. The infographic will be built as a series of slides and then combined into one elongated slide and saved as an image. Our first slide will include religion and age breakdown as well as geographic information. See slide requirements. The due date for this slide has been moved back to April 10. There have been some open labs as well. After that we will be moving on to the next phase of the project. 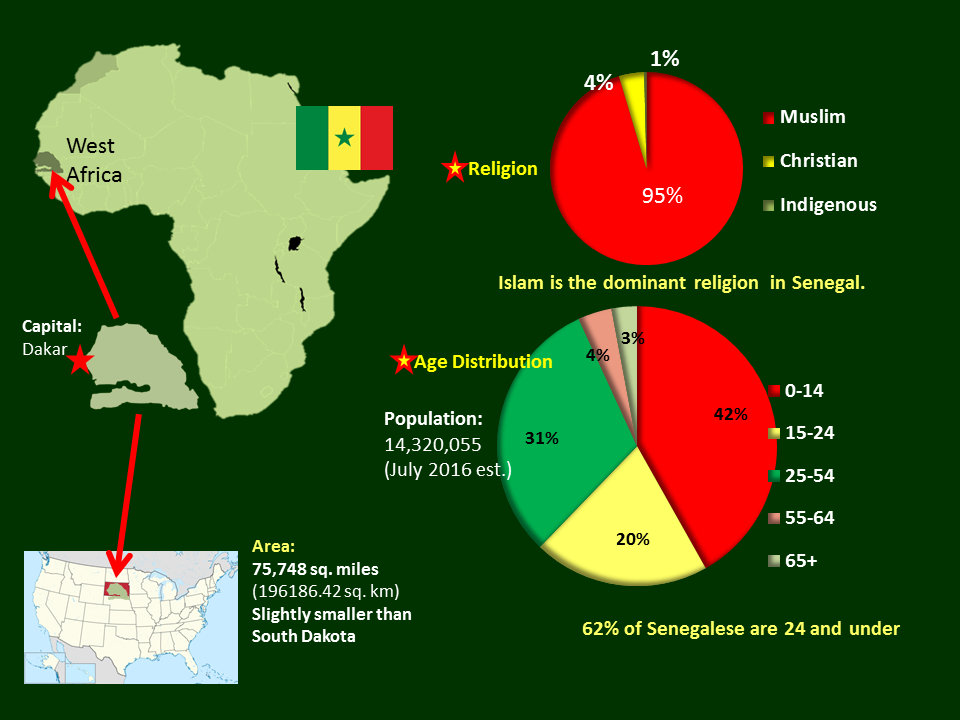 Sample slide: Senegal Comments are closed.
|
 RSS Feed