|
1/22/2017 January 22, 2017Seventh graders should be making progress in the coding assignment 007-7 in which they decide how far they want to extend their coding skills. Whatever is finished by January 31 will be recorded as a participation grade based on the chart. Students should be sure to "Mark As Done" in Google Classroom when they have reached the end of the coding activity. We have begun investigating infographics as a means of data visualization and communication. In 008-8 students will be searching for an infographic that has a connection to one or more of the Global Goals. The due date for all students to fill in their chosen infographic name and link on the shared document is Jan. 27. Students have been cautioned that 1) they must choose a unique infographic, so any that are already taken are off limits and 2) they may not alter anyone else's entry. I have, however, looked at what has been chosen so far and there are many students who must revisit their entry and either correct it or choose something else entirely. I have color coded the entries as follows: 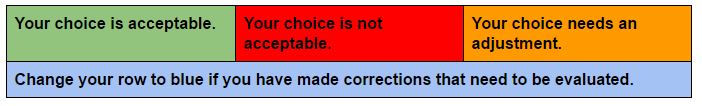 Some students have chosen web pages rather than actual infographics. Some have chosen an infographic that cannot be enlarged enough to be readable. Some have chosen an infographic that does not have a connection to Global Goals. One example might be an infographic showing different types of salads. Just because one of the goals is decreasing hunger in the world, this does not mean that the infographic has a connection to the goal because it contains food. An infographic dealing with hunger statistics or hunger related illnesses, etc. would be more appropriate. Once the choices have been made students will be analyzing the graphic design as well as the content to discover what makes a useful and interesting infographic and then sharing those findings with the class. That will be 009-8 which has not yet been posted in Google Classroom. From there we can branch out to trying out hand at creating our own infographics.
Comments are closed.
|
 RSS Feed