|
4/2/2015 April 2, 2015At the end of the third quarter, 7th graders have 3 graded assignments: the age distribution chart, the geography information, and the per capita income chart. After looking at the scoresheet for the per capita chart for their assigned African country, students should have re-checked the life expectancy or infant mortality chart to be sure the same mistakes were not made for that chart. We will finish up the infographic in the next 2 weeks and get it ready for public sharing. There will be several open labs for students who need to catch up on something in order to finish on time. We still have several other topics and activities for the 4th quarter. I will be checking the double column chart (life expectancy or infant mortality) over the weekend and our class on Wednesday, April 8, should be putting finishing touches on the final parts of the information. Students can be researching the organization they wish to feature in their infographic and have all their information ready to be inserted into the slide. 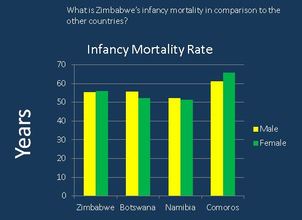 Double column chart by Emma Comments are closed.
|
 RSS Feed